{
"cells": [
{
"cell_type": "markdown",
"metadata": {},
"source": [
"# Introduction to Machine Learning"
]
},
{
"cell_type": "markdown",
"metadata": {},
"source": [
"## 1 - Reactive vs Learning Agent\n",
"\n",
"NOTE: We will use the `numpy` package for vector-based computations\n",
"\n",
"### 1.1 - A very simple machine that learns a pattern\n",
"\n",
"* A reactive agent is a program that reacts to a predefined set of rules (patterns), for example:"
]
},
{
"cell_type": "code",
"execution_count": null,
"metadata": {},
"outputs": [],
"source": [
"import numpy as np\n",
"\n",
"def reactive_agent(x):\n",
" if x > 10.0:\n",
" return True\n",
" else:\n",
" return False\n",
" \n",
"vreact = np.vectorize(reactive_agent)"
]
},
{
"cell_type": "markdown",
"metadata": {},
"source": [
"* Given some data, it applies the rules:\n",
"\n"
]
},
{
"cell_type": "code",
"execution_count": null,
"metadata": {},
"outputs": [],
"source": [
"X = np.array([10.9, 5.34, 8.32, 12.43, 20.32, 7.24])\n",
"y = vreact(X)\n",
"print(y)"
]
},
{
"cell_type": "code",
"execution_count": null,
"metadata": {},
"outputs": [],
"source": [
"vtrue = np.mean(X[y==True])\n",
"vfalse = np.mean(X[y==False])\n",
"x = 10.75\n",
"print(np.abs(x - vtrue))\n",
"print(np.abs(x - vfalse))\n",
"print((vtrue + vfalse)/2)"
]
},
{
"cell_type": "markdown",
"metadata": {},
"source": [
"* A learning agent, learns from data (in this case labels) to infer the pattern."
]
},
{
"cell_type": "code",
"execution_count": null,
"metadata": {},
"outputs": [],
"source": [
"def learning_agent(x,Data,labels):\n",
" v_true = np.mean(Data[labels==True])\n",
" v_false = np.mean(Data[labels==False])\n",
" d_true = np.abs(x - v_true)\n",
" d_false = np.abs(x - v_false)\n",
" if d_true < d_false:\n",
" return True\n",
" else:\n",
" return False\n",
" "
]
},
{
"cell_type": "markdown",
"metadata": {},
"source": [
"Let us define a random vector of data to test"
]
},
{
"cell_type": "code",
"execution_count": null,
"metadata": {},
"outputs": [],
"source": [
"vect = np.random.random(10)*20\n",
"learnag = lambda x: learning_agent(x,X,y)\n",
"vlearn = np.vectorize(learnag)\n",
"print(vect)\n",
"vlearn(vect)"
]
},
{
"cell_type": "markdown",
"metadata": {},
"source": [
"Which pattern is the learning machine using?"
]
},
{
"cell_type": "code",
"execution_count": null,
"metadata": {},
"outputs": [],
"source": [
"def get_pattern():\n",
" v_true = np.mean(X[y==True])\n",
" v_false = np.mean(X[y==False])\n",
" return (v_true + v_false)/2\n",
"\n",
"get_pattern()"
]
},
{
"cell_type": "markdown",
"metadata": {},
"source": [
"### 1.2 - How the pattern evolve with the data size?\n",
"\n",
"* Let us now change `X` and `y` for a random vector and the output of the ractive agent respectively."
]
},
{
"cell_type": "code",
"execution_count": null,
"metadata": {},
"outputs": [],
"source": [
"scale = 20.0\n",
"def generate_data(n):\n",
" X = np.random.rand(n)*scale\n",
" y = vreact(X)\n",
" return(X,y)"
]
},
{
"cell_type": "markdown",
"metadata": {},
"source": [
"* And see how the pattern behave..."
]
},
{
"cell_type": "code",
"execution_count": null,
"metadata": {},
"outputs": [],
"source": [
"X,y = generate_data(100)\n",
"get_pattern()"
]
},
{
"cell_type": "markdown",
"metadata": {},
"source": [
"* Now, we will repeat that for several values of `n` many times. We will record the mean and the standard deviation for every `n` value."
]
},
{
"cell_type": "code",
"execution_count": null,
"metadata": {},
"outputs": [],
"source": [
"reps = 100\n",
"nvals =np.arange(10,1000,10)\n",
"pmean = []\n",
"pvar = []\n",
"for n in nvals:\n",
" pm = 0\n",
" pv = 0\n",
" for i in range(reps):\n",
" X,y = generate_data(int(n))\n",
" val = get_pattern()\n",
" pm += val \n",
" pv += val*val\n",
" pm=pm/np.float(reps)\n",
" pv=np.sqrt(pv/np.float(reps)- pm*pm)\n",
" pmean.append(pm) \n",
" pvar.append(pv)\n",
"pmean=np.array(pmean)\n",
"pvar=np.array(pvar)"
]
},
{
"cell_type": "markdown",
"metadata": {},
"source": [
"* And plot the mean and variance using the `matplotlib` library."
]
},
{
"cell_type": "code",
"execution_count": null,
"metadata": {},
"outputs": [],
"source": [
"%matplotlib notebook\n",
"import matplotlib.pyplot as plt\n",
"plt.plot(nvals,np.ones(len(nvals))*10,color='red',label='true pattern')\n",
"plt.plot(nvals,pmean,color='blue',label='mean')\n",
"plt.fill_between(nvals, pmean + pvar, pmean-pvar, facecolor='green', alpha=0.3,label=\"std\")\n",
"plt.legend()\n",
"plt.ylabel(\"pattern\")\n",
"plt.xlabel(\"n\")\n",
"plt.show()"
]
},
{
"cell_type": "markdown",
"metadata": {},
"source": [
"### 1.3 - what about wrong labels?\n",
"* Labels are not always reliable. \n",
"* To simulate this, let us fix `n = 1000` and randomly modify labels."
]
},
{
"cell_type": "code",
"execution_count": null,
"metadata": {},
"outputs": [],
"source": [
"reps = 200\n",
"n = 1000\n",
"jvals =np.arange(1,1000,5)\n",
"pmean = []\n",
"pvar = []\n",
"for j in jvals: \n",
" pm = 0\n",
" pv = 0\n",
" for i in range(reps):\n",
" X,y = generate_data(int(n))\n",
" inds = np.random.choice(y.size, size=j,replace=False)\n",
" y[inds]=np.invert(y[inds])\n",
" val = get_pattern()\n",
" pm += val \n",
" pv += val*val\n",
" pm=pm/np.float(reps)\n",
" pv=np.sqrt(pv/np.float(reps)- pm*pm)\n",
" pmean.append(pm) \n",
" pvar.append(pv)\n",
"pmean=np.array(pmean)\n",
"pvar=np.array(pvar)"
]
},
{
"cell_type": "markdown",
"metadata": {},
"source": [
"* And plot the mean and variance w.r.t. the number of random changes"
]
},
{
"cell_type": "code",
"execution_count": null,
"metadata": {},
"outputs": [],
"source": [
"%matplotlib inline\n",
"import matplotlib.pyplot as plt\n",
"plt.plot(jvals,np.ones(len(jvals))*10,color='red',label='true pattern')\n",
"plt.plot(jvals,pmean,color='blue',label='mean')\n",
"plt.fill_between(jvals, pmean + pvar, pmean-pvar, facecolor='green', alpha=0.3,label=\"std\")\n",
"plt.legend()\n",
"plt.ylabel(\"pattern\")\n",
"plt.xlabel(\"modified elements\")\n",
"plt.show()"
]
},
{
"cell_type": "markdown",
"metadata": {},
"source": [
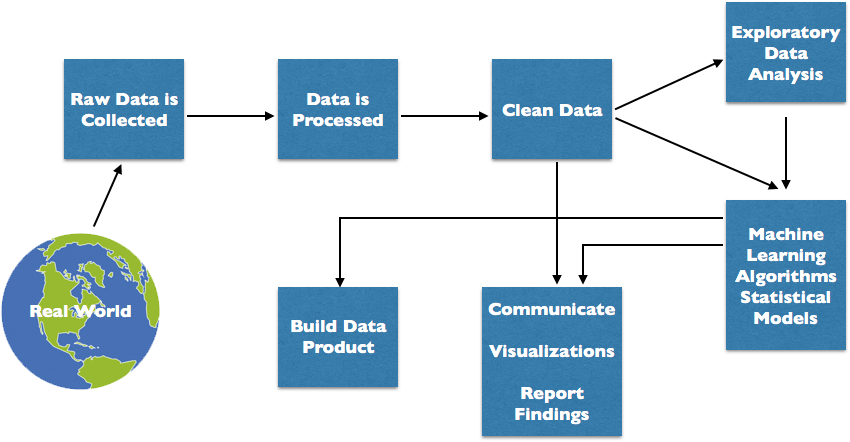
"## 2 - Exploratory Analysis in 7 Questions About Data\n",
"\n",
"We will explore the FIFA 2019 data (you can find it in Kaggle). \n",
"\n",
"Here is the textbook data science process.\n",
"\n",
"\n",
"\n",
"However, in practice one goes back and forward to achieve an exploratory data analysis.\n",
"\n",
"### 2.1 -What is the data made of?\n",
"\n",
"* FIFA data comes in a `.csv` format\n",
"* We will use pandas package as our data manager, and it can read CSVs!"
]
},
{
"cell_type": "code",
"execution_count": null,
"metadata": {},
"outputs": [],
"source": [
"import pandas"
]
},
{
"cell_type": "markdown",
"metadata": {},
"source": [
"* We can read a comma separated values file as a pandas dataframe (i.e. a Table object)."
]
},
{
"cell_type": "code",
"execution_count": null,
"metadata": {
"scrolled": true
},
"outputs": [],
"source": [
"table=pandas.read_csv(\"data.csv\")\n",
"table['CAM']"
]
},
{
"cell_type": "markdown",
"metadata": {},
"source": [
"* To explore this data, first we need to check the column names and be sure about the semantics."
]
},
{
"cell_type": "code",
"execution_count": null,
"metadata": {},
"outputs": [],
"source": [
"table.columns"
]
},
{
"cell_type": "code",
"execution_count": null,
"metadata": {
"scrolled": true
},
"outputs": [],
"source": [
"table[['Name','Age','Nationality','Overall','Potential','Value']]"
]
},
{
"cell_type": "code",
"execution_count": null,
"metadata": {},
"outputs": [],
"source": [
"v=table['Value'][0]\n",
"v"
]
},
{
"cell_type": "code",
"execution_count": null,
"metadata": {},
"outputs": [],
"source": [
"type(v)"
]
},
{
"cell_type": "code",
"execution_count": null,
"metadata": {
"scrolled": true
},
"outputs": [],
"source": [
"from IPython.core.display import display, HTML\n",
"# HTML hack to see images\n",
"img_lst = []\n",
"for purl in table['Photo']:\n",
" img_lst.append(' ')\n",
"table['Picture']=img_lst\n",
"img_lst = []\n",
"for purl in table['Flag']:\n",
" img_lst.append('')\n",
"table['Country']=img_lst\n",
"img_lst = []\n",
"for purl in table['Club Logo']:\n",
" img_lst.append('')\n",
"table['FCLogo']=img_lst\n",
"pandas.set_option('display.max_colwidth', -1)\n",
"t100 = table[1:100]\n",
"HTML(t100[['Picture','Name','Age','Nationality','Country','Club','FCLogo','Overall','Potential','Value']].to_html(escape=False))"
]
},
{
"cell_type": "code",
"execution_count": null,
"metadata": {},
"outputs": [],
"source": [
"%matplotlib inline\n",
"table.plot.scatter(\"Overall\",\"Potential\")"
]
},
{
"cell_type": "code",
"execution_count": null,
"metadata": {},
"outputs": [],
"source": [
"import matplotlib.pyplot as plt\n",
"plt.scatter(table.Age,table.Potential)\n",
"plt.xlabel(\"Age\")\n",
"plt.ylabel(\"Potential\")\n",
"plt.title(\"All\")"
]
},
{
"cell_type": "markdown",
"metadata": {},
"source": [
"### 1.2.2 - What we need to fix of the Data?\n",
"* Usually, not all fields are used for every sample, and some values are in human-readable form (not numerical, i.e., String).\n",
"* Let us fix the currency values first"
]
},
{
"cell_type": "code",
"execution_count": null,
"metadata": {},
"outputs": [],
"source": [
"import numpy as np\n",
"# Convert currency to floats\n",
"table['Unit'] = table['Value'].str[-1]\n",
"table['ValueNum'] = np.where(table['Unit'] == '0', 0, \n",
" table['Value'].str[1:-1].replace(r'[a-zA-Z]',''))\n",
"table['ValueNum'] = table['ValueNum'].astype(float)\n",
"table['ValueNum'] = np.where(table['Unit'] == 'M', \n",
" table['ValueNum'], \n",
" table['ValueNum']/1000)\n",
"\n",
"table['Unit2'] = table['Wage'].str[-1]\n",
"table['WageNum'] = np.where(table['Unit2'] == '0', 0, \n",
" table['Wage'].str[1:-1].replace(r'[a-zA-Z]',''))\n",
"table['WageNum'] = table['WageNum'].astype(float)\n",
"table['WageNum'] = np.where(table['Unit2'] == 'M', \n",
" table['WageNum'], \n",
" table['WageNum']/1000)\n",
"table[['Value','ValueNum','Wage','WageNum']]"
]
},
{
"cell_type": "markdown",
"metadata": {},
"source": [
"* That allowed us reach more data!"
]
},
{
"cell_type": "code",
"execution_count": null,
"metadata": {},
"outputs": [],
"source": [
"plt.figure()\n",
"plt.scatter(table['Overall'],table['ValueNum'],alpha=0.3)\n",
"plt.xlabel(\"Overall\")\n",
"plt.ylabel(\"Price\")"
]
},
{
"cell_type": "markdown",
"metadata": {},
"source": [
"### 2.3 - How to we organize the data?"
]
},
{
"cell_type": "code",
"execution_count": null,
"metadata": {},
"outputs": [],
"source": [
"grouped = table.groupby('Nationality')"
]
},
{
"cell_type": "code",
"execution_count": null,
"metadata": {},
"outputs": [],
"source": [
"cant=grouped.size()\n",
"top15 = cant.sort_values(ascending=False)[:15]\n",
"top15"
]
},
{
"cell_type": "code",
"execution_count": null,
"metadata": {},
"outputs": [],
"source": [
"import warnings\n",
"warnings.filterwarnings('ignore')\n",
"import numpy as np\n",
"color=plt.cm.rainbow(np.linspace(0,1,top15.size))\n",
"\n",
"i=0\n",
"for country in top15.keys():\n",
" plt.figure()\n",
" elms=grouped.groups[country]\n",
" plt.scatter(table['Overall'][elms],table['ValueNum'][elms],c=color[i],alpha=0.3)\n",
" plt.title(country)\n",
" plt.xlabel(\"Overall\")\n",
" plt.ylabel(\"Price\")\n",
" i+=1"
]
},
{
"cell_type": "code",
"execution_count": null,
"metadata": {
"scrolled": false
},
"outputs": [],
"source": []
},
{
"cell_type": "markdown",
"metadata": {},
"source": [
"### 1.2.4 - How do we clean/select the data?"
]
},
{
"cell_type": "code",
"execution_count": null,
"metadata": {},
"outputs": [],
"source": [
"fulltab=table.dropna(axis=1)\n",
"print(str(len(table.columns) - len(fulltab.columns)) + \" columns removed for incompleteness\")"
]
},
{
"cell_type": "code",
"execution_count": null,
"metadata": {},
"outputs": [],
"source": [
"fulltab.columns"
]
},
{
"cell_type": "code",
"execution_count": null,
"metadata": {
"scrolled": true
},
"outputs": [],
"source": [
"num_feat = ['Age', 'Overall', 'Potential', 'Special',\n",
" 'Acceleration', 'Aggression', 'Agility', 'Balance', 'BallControl',\n",
" 'Composure', 'Crossing', 'Curve', 'Dribbling',\n",
" 'FKAccuracy', 'Finishing', 'GKDiving', 'GKHandling', 'GKKicking',\n",
" 'GKPositioning', 'GKReflexes', 'HeadingAccuracy', 'Interceptions',\n",
" 'Jumping', 'LongPassing', 'LongShots', 'Marking', 'Penalties',\n",
" 'Positioning', 'Reactions',\n",
" 'ShortPassing', 'ShotPower', 'Skill Moves', 'SlidingTackle',\n",
" 'SprintSpeed', 'Stamina', 'StandingTackle', 'Strength', 'Vision',\n",
" 'Volleys','ValueNum','WageNum']\n",
"santab=fulltab[num_feat].astype(float)\n",
"santab"
]
},
{
"cell_type": "markdown",
"metadata": {},
"source": [
"### 2.5 - Does the content of our data make sense?"
]
},
{
"cell_type": "code",
"execution_count": null,
"metadata": {},
"outputs": [],
"source": [
"import seaborn as sns\n",
"def plot_corr_matrix(data,features=None,annot=True,s=(16,10)):\n",
" fig= plt.figure(figsize=s)\n",
" ax= fig.add_subplot(111)\n",
" if features is None:\n",
" corr = data.corr()\n",
" else:\n",
" corr = data[features].corr()\n",
" ax= sns.heatmap(corr,annot=annot,\n",
" xticklabels=corr.columns,\n",
" yticklabels=corr.columns, cmap=\"seismic\",vmin=-1,vmax=1)\n",
" plt.title(\"Correlation Matrix\", fontsize = 15)\n",
" plt.show()\n",
" \n",
"plot_corr_matrix(santab,annot=False)"
]
},
{
"cell_type": "code",
"execution_count": null,
"metadata": {},
"outputs": [],
"source": [
"feat_select = ['Age','Overall',\n",
" 'Potential', 'Special','ValueNum','WageNum']\n",
"plot_corr_matrix(santab,features=feat_select)"
]
},
{
"cell_type": "markdown",
"metadata": {},
"source": [
"### 2.6 -Can we simplify things?"
]
},
{
"cell_type": "code",
"execution_count": null,
"metadata": {},
"outputs": [],
"source": [
"from sklearn.decomposition import PCA\n",
"from sklearn.preprocessing import StandardScaler\n",
"\n",
"scaler = StandardScaler().fit(santab)\n",
"stdtab = pandas.DataFrame(scaler.transform(santab))\n",
"n = len(stdtab.columns)\n",
"sklearn_pca = PCA(n_components=n,random_state=1)\n",
"xpca = sklearn_pca.fit_transform(stdtab)\n",
"varx=sklearn_pca.explained_variance_ratio_\n",
"plt.plot(np.arange(1,n+1),varx.cumsum())\n",
"plt.ylabel(\"% of variance\")\n",
"plt.xlabel(\"components\")"
]
},
{
"cell_type": "code",
"execution_count": null,
"metadata": {},
"outputs": [],
"source": [
"components = sklearn_pca.components_\n",
"ind=[]\n",
"for i in range(components.shape[0]):\n",
" ind.append(\"PC\"+str(i+1))\n",
"feature_weights= pandas.DataFrame(np.abs(components),columns=santab.columns,index=ind)\n",
"fig= plt.figure(figsize=(16,10))\n",
"ax= fig.add_subplot(111)\n",
"ax = sns.heatmap(feature_weights,cmap=\"jet\",vmin=0,vmax=1)"
]
},
{
"cell_type": "code",
"execution_count": null,
"metadata": {},
"outputs": [],
"source": [
"n = 5\n",
"sklearn_pca = PCA(n_components=n,random_state=1)\n",
"ind=[]\n",
"for i in range(n):\n",
" ind.append(\"PC\"+str(i+1))\n",
"xpca = sklearn_pca.fit_transform(stdtab)\n",
"varx=sklearn_pca.explained_variance_ratio_\n",
"plt.plot(np.arange(1,n+1),varx.cumsum())\n",
"plt.ylabel(\"% of variance\")\n",
"plt.xlabel(\"components\")"
]
},
{
"cell_type": "code",
"execution_count": null,
"metadata": {},
"outputs": [],
"source": [
"transtab = pandas.DataFrame(xpca,columns=ind)\n",
"sns.pairplot(transtab,diag_kind=\"kde\")"
]
},
{
"cell_type": "markdown",
"metadata": {},
"source": [
"### 2.7 -Can we automatize the pattern recognition?"
]
},
{
"cell_type": "code",
"execution_count": null,
"metadata": {},
"outputs": [],
"source": [
"from sklearn.cluster import KMeans, DBSCAN\n",
"from ipywidgets import interact\n",
"rad = 5.0\n",
"db = DBSCAN(rad,min_samples=50).fit(xpca) \n",
"transtab['cluster']=db.labels_\n",
"sns.pairplot(transtab,vars=ind, hue=\"cluster\")"
]
},
{
"cell_type": "code",
"execution_count": null,
"metadata": {},
"outputs": [],
"source": [
"tclust2 = table[transtab['cluster']==0]\n",
"HTML(tclust2[['Unnamed: 0','Picture','Name','Age','Country','FCLogo']].to_html(escape=False))"
]
},
{
"cell_type": "code",
"execution_count": null,
"metadata": {},
"outputs": [],
"source": [
"tclust1 = xpca[transtab['cluster']==0]\n",
"torig1 = table[transtab['cluster']==0].copy()\n",
"km = KMeans(5).fit(tclust1) \n",
"newtab = pandas.DataFrame(tclust1,columns=ind)\n",
"newtab['cluster']=km.labels_\n",
"sns.pairplot(newtab,vars=ind, hue=\"cluster\")"
]
},
{
"cell_type": "code",
"execution_count": null,
"metadata": {},
"outputs": [],
"source": [
"#newtab\n",
"#HTML(tclust2[['Unnamed: 0','Picture','Name','Age','Country','FCLogo']].to_html(escape=False))"
]
},
{
"cell_type": "code",
"execution_count": null,
"metadata": {},
"outputs": [],
"source": []
},
{
"cell_type": "code",
"execution_count": null,
"metadata": {},
"outputs": [],
"source": []
},
{
"cell_type": "code",
"execution_count": null,
"metadata": {},
"outputs": [],
"source": []
},
{
"cell_type": "code",
"execution_count": null,
"metadata": {},
"outputs": [],
"source": []
}
],
"metadata": {
"kernelspec": {
"display_name": "Python 3",
"language": "python",
"name": "python3"
},
"language_info": {
"codemirror_mode": {
"name": "ipython",
"version": 3
},
"file_extension": ".py",
"mimetype": "text/x-python",
"name": "python",
"nbconvert_exporter": "python",
"pygments_lexer": "ipython3",
"version": "3.7.3"
}
},
"nbformat": 4,
"nbformat_minor": 2
}
')\n",
"table['Picture']=img_lst\n",
"img_lst = []\n",
"for purl in table['Flag']:\n",
" img_lst.append('')\n",
"table['Country']=img_lst\n",
"img_lst = []\n",
"for purl in table['Club Logo']:\n",
" img_lst.append('')\n",
"table['FCLogo']=img_lst\n",
"pandas.set_option('display.max_colwidth', -1)\n",
"t100 = table[1:100]\n",
"HTML(t100[['Picture','Name','Age','Nationality','Country','Club','FCLogo','Overall','Potential','Value']].to_html(escape=False))"
]
},
{
"cell_type": "code",
"execution_count": null,
"metadata": {},
"outputs": [],
"source": [
"%matplotlib inline\n",
"table.plot.scatter(\"Overall\",\"Potential\")"
]
},
{
"cell_type": "code",
"execution_count": null,
"metadata": {},
"outputs": [],
"source": [
"import matplotlib.pyplot as plt\n",
"plt.scatter(table.Age,table.Potential)\n",
"plt.xlabel(\"Age\")\n",
"plt.ylabel(\"Potential\")\n",
"plt.title(\"All\")"
]
},
{
"cell_type": "markdown",
"metadata": {},
"source": [
"### 1.2.2 - What we need to fix of the Data?\n",
"* Usually, not all fields are used for every sample, and some values are in human-readable form (not numerical, i.e., String).\n",
"* Let us fix the currency values first"
]
},
{
"cell_type": "code",
"execution_count": null,
"metadata": {},
"outputs": [],
"source": [
"import numpy as np\n",
"# Convert currency to floats\n",
"table['Unit'] = table['Value'].str[-1]\n",
"table['ValueNum'] = np.where(table['Unit'] == '0', 0, \n",
" table['Value'].str[1:-1].replace(r'[a-zA-Z]',''))\n",
"table['ValueNum'] = table['ValueNum'].astype(float)\n",
"table['ValueNum'] = np.where(table['Unit'] == 'M', \n",
" table['ValueNum'], \n",
" table['ValueNum']/1000)\n",
"\n",
"table['Unit2'] = table['Wage'].str[-1]\n",
"table['WageNum'] = np.where(table['Unit2'] == '0', 0, \n",
" table['Wage'].str[1:-1].replace(r'[a-zA-Z]',''))\n",
"table['WageNum'] = table['WageNum'].astype(float)\n",
"table['WageNum'] = np.where(table['Unit2'] == 'M', \n",
" table['WageNum'], \n",
" table['WageNum']/1000)\n",
"table[['Value','ValueNum','Wage','WageNum']]"
]
},
{
"cell_type": "markdown",
"metadata": {},
"source": [
"* That allowed us reach more data!"
]
},
{
"cell_type": "code",
"execution_count": null,
"metadata": {},
"outputs": [],
"source": [
"plt.figure()\n",
"plt.scatter(table['Overall'],table['ValueNum'],alpha=0.3)\n",
"plt.xlabel(\"Overall\")\n",
"plt.ylabel(\"Price\")"
]
},
{
"cell_type": "markdown",
"metadata": {},
"source": [
"### 2.3 - How to we organize the data?"
]
},
{
"cell_type": "code",
"execution_count": null,
"metadata": {},
"outputs": [],
"source": [
"grouped = table.groupby('Nationality')"
]
},
{
"cell_type": "code",
"execution_count": null,
"metadata": {},
"outputs": [],
"source": [
"cant=grouped.size()\n",
"top15 = cant.sort_values(ascending=False)[:15]\n",
"top15"
]
},
{
"cell_type": "code",
"execution_count": null,
"metadata": {},
"outputs": [],
"source": [
"import warnings\n",
"warnings.filterwarnings('ignore')\n",
"import numpy as np\n",
"color=plt.cm.rainbow(np.linspace(0,1,top15.size))\n",
"\n",
"i=0\n",
"for country in top15.keys():\n",
" plt.figure()\n",
" elms=grouped.groups[country]\n",
" plt.scatter(table['Overall'][elms],table['ValueNum'][elms],c=color[i],alpha=0.3)\n",
" plt.title(country)\n",
" plt.xlabel(\"Overall\")\n",
" plt.ylabel(\"Price\")\n",
" i+=1"
]
},
{
"cell_type": "code",
"execution_count": null,
"metadata": {
"scrolled": false
},
"outputs": [],
"source": []
},
{
"cell_type": "markdown",
"metadata": {},
"source": [
"### 1.2.4 - How do we clean/select the data?"
]
},
{
"cell_type": "code",
"execution_count": null,
"metadata": {},
"outputs": [],
"source": [
"fulltab=table.dropna(axis=1)\n",
"print(str(len(table.columns) - len(fulltab.columns)) + \" columns removed for incompleteness\")"
]
},
{
"cell_type": "code",
"execution_count": null,
"metadata": {},
"outputs": [],
"source": [
"fulltab.columns"
]
},
{
"cell_type": "code",
"execution_count": null,
"metadata": {
"scrolled": true
},
"outputs": [],
"source": [
"num_feat = ['Age', 'Overall', 'Potential', 'Special',\n",
" 'Acceleration', 'Aggression', 'Agility', 'Balance', 'BallControl',\n",
" 'Composure', 'Crossing', 'Curve', 'Dribbling',\n",
" 'FKAccuracy', 'Finishing', 'GKDiving', 'GKHandling', 'GKKicking',\n",
" 'GKPositioning', 'GKReflexes', 'HeadingAccuracy', 'Interceptions',\n",
" 'Jumping', 'LongPassing', 'LongShots', 'Marking', 'Penalties',\n",
" 'Positioning', 'Reactions',\n",
" 'ShortPassing', 'ShotPower', 'Skill Moves', 'SlidingTackle',\n",
" 'SprintSpeed', 'Stamina', 'StandingTackle', 'Strength', 'Vision',\n",
" 'Volleys','ValueNum','WageNum']\n",
"santab=fulltab[num_feat].astype(float)\n",
"santab"
]
},
{
"cell_type": "markdown",
"metadata": {},
"source": [
"### 2.5 - Does the content of our data make sense?"
]
},
{
"cell_type": "code",
"execution_count": null,
"metadata": {},
"outputs": [],
"source": [
"import seaborn as sns\n",
"def plot_corr_matrix(data,features=None,annot=True,s=(16,10)):\n",
" fig= plt.figure(figsize=s)\n",
" ax= fig.add_subplot(111)\n",
" if features is None:\n",
" corr = data.corr()\n",
" else:\n",
" corr = data[features].corr()\n",
" ax= sns.heatmap(corr,annot=annot,\n",
" xticklabels=corr.columns,\n",
" yticklabels=corr.columns, cmap=\"seismic\",vmin=-1,vmax=1)\n",
" plt.title(\"Correlation Matrix\", fontsize = 15)\n",
" plt.show()\n",
" \n",
"plot_corr_matrix(santab,annot=False)"
]
},
{
"cell_type": "code",
"execution_count": null,
"metadata": {},
"outputs": [],
"source": [
"feat_select = ['Age','Overall',\n",
" 'Potential', 'Special','ValueNum','WageNum']\n",
"plot_corr_matrix(santab,features=feat_select)"
]
},
{
"cell_type": "markdown",
"metadata": {},
"source": [
"### 2.6 -Can we simplify things?"
]
},
{
"cell_type": "code",
"execution_count": null,
"metadata": {},
"outputs": [],
"source": [
"from sklearn.decomposition import PCA\n",
"from sklearn.preprocessing import StandardScaler\n",
"\n",
"scaler = StandardScaler().fit(santab)\n",
"stdtab = pandas.DataFrame(scaler.transform(santab))\n",
"n = len(stdtab.columns)\n",
"sklearn_pca = PCA(n_components=n,random_state=1)\n",
"xpca = sklearn_pca.fit_transform(stdtab)\n",
"varx=sklearn_pca.explained_variance_ratio_\n",
"plt.plot(np.arange(1,n+1),varx.cumsum())\n",
"plt.ylabel(\"% of variance\")\n",
"plt.xlabel(\"components\")"
]
},
{
"cell_type": "code",
"execution_count": null,
"metadata": {},
"outputs": [],
"source": [
"components = sklearn_pca.components_\n",
"ind=[]\n",
"for i in range(components.shape[0]):\n",
" ind.append(\"PC\"+str(i+1))\n",
"feature_weights= pandas.DataFrame(np.abs(components),columns=santab.columns,index=ind)\n",
"fig= plt.figure(figsize=(16,10))\n",
"ax= fig.add_subplot(111)\n",
"ax = sns.heatmap(feature_weights,cmap=\"jet\",vmin=0,vmax=1)"
]
},
{
"cell_type": "code",
"execution_count": null,
"metadata": {},
"outputs": [],
"source": [
"n = 5\n",
"sklearn_pca = PCA(n_components=n,random_state=1)\n",
"ind=[]\n",
"for i in range(n):\n",
" ind.append(\"PC\"+str(i+1))\n",
"xpca = sklearn_pca.fit_transform(stdtab)\n",
"varx=sklearn_pca.explained_variance_ratio_\n",
"plt.plot(np.arange(1,n+1),varx.cumsum())\n",
"plt.ylabel(\"% of variance\")\n",
"plt.xlabel(\"components\")"
]
},
{
"cell_type": "code",
"execution_count": null,
"metadata": {},
"outputs": [],
"source": [
"transtab = pandas.DataFrame(xpca,columns=ind)\n",
"sns.pairplot(transtab,diag_kind=\"kde\")"
]
},
{
"cell_type": "markdown",
"metadata": {},
"source": [
"### 2.7 -Can we automatize the pattern recognition?"
]
},
{
"cell_type": "code",
"execution_count": null,
"metadata": {},
"outputs": [],
"source": [
"from sklearn.cluster import KMeans, DBSCAN\n",
"from ipywidgets import interact\n",
"rad = 5.0\n",
"db = DBSCAN(rad,min_samples=50).fit(xpca) \n",
"transtab['cluster']=db.labels_\n",
"sns.pairplot(transtab,vars=ind, hue=\"cluster\")"
]
},
{
"cell_type": "code",
"execution_count": null,
"metadata": {},
"outputs": [],
"source": [
"tclust2 = table[transtab['cluster']==0]\n",
"HTML(tclust2[['Unnamed: 0','Picture','Name','Age','Country','FCLogo']].to_html(escape=False))"
]
},
{
"cell_type": "code",
"execution_count": null,
"metadata": {},
"outputs": [],
"source": [
"tclust1 = xpca[transtab['cluster']==0]\n",
"torig1 = table[transtab['cluster']==0].copy()\n",
"km = KMeans(5).fit(tclust1) \n",
"newtab = pandas.DataFrame(tclust1,columns=ind)\n",
"newtab['cluster']=km.labels_\n",
"sns.pairplot(newtab,vars=ind, hue=\"cluster\")"
]
},
{
"cell_type": "code",
"execution_count": null,
"metadata": {},
"outputs": [],
"source": [
"#newtab\n",
"#HTML(tclust2[['Unnamed: 0','Picture','Name','Age','Country','FCLogo']].to_html(escape=False))"
]
},
{
"cell_type": "code",
"execution_count": null,
"metadata": {},
"outputs": [],
"source": []
},
{
"cell_type": "code",
"execution_count": null,
"metadata": {},
"outputs": [],
"source": []
},
{
"cell_type": "code",
"execution_count": null,
"metadata": {},
"outputs": [],
"source": []
},
{
"cell_type": "code",
"execution_count": null,
"metadata": {},
"outputs": [],
"source": []
}
],
"metadata": {
"kernelspec": {
"display_name": "Python 3",
"language": "python",
"name": "python3"
},
"language_info": {
"codemirror_mode": {
"name": "ipython",
"version": 3
},
"file_extension": ".py",
"mimetype": "text/x-python",
"name": "python",
"nbconvert_exporter": "python",
"pygments_lexer": "ipython3",
"version": "3.7.3"
}
},
"nbformat": 4,
"nbformat_minor": 2
}